Share of Voice forecasting system, Fortune 500 APAC (Artefact)
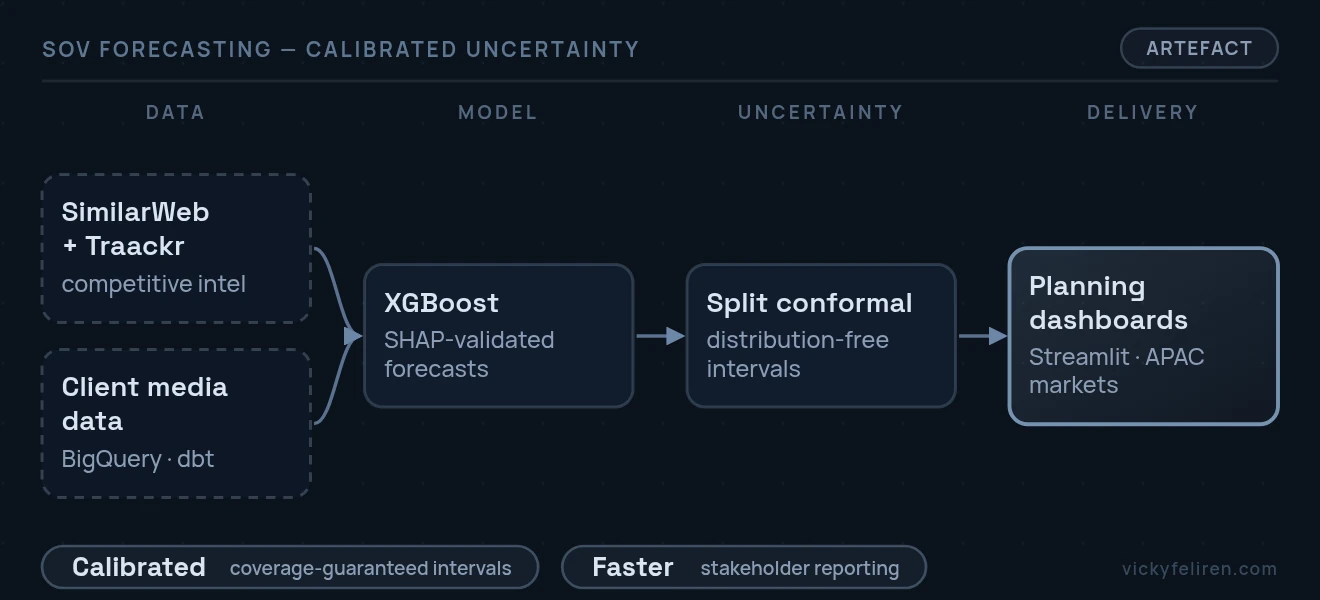
A Fortune 500 beauty company needed to forecast Share of Voice across six APAC markets, five product groups, four divisions, and Meta, Instagram, TikTok, and YouTube. Media leaders used monthly spreadsheets that arrived three to four weeks late to decide where brands were over- or under-funded.
The data produced hundreds of short, sparse time series across category, country, division, and platform. Campaign cycles caused seasonality, while competitor spending mixed with organic brand growth. Linear regression missed nonlinear effects from platform changes and spending surges. A single forecast was also too precise for budget decisions. Planners needed reliable ranges they could defend to finance leaders.
I replaced linear regression with XGBoost and used SHAP to explain its results. Client media teams checked the explanations against their domain knowledge. BigQuery and dbt combined platform engagement data with SimilarWeb traffic and Traackr influencer signals.
I added split conformal prediction to XGBoost, replacing point forecasts with calibrated intervals and coverage guarantees. The evaluation pipeline tracked calibration drift and empirical coverage on rolling holdouts, targeting 90% interval coverage alongside forecast accuracy.
I built the pipeline on Vertex AI Workbench with automated ingestion, versioned dbt features, experiment tracking, and Streamlit dashboards. The dashboards turned model output into market-share views for commercial teams. As the office's sole technical contributor, I also set standards for code review, reproducibility, and configuration.
I built a RAG proof of concept for business users. Human reviewers checked factual accuracy and relevance, while LangSmith tracked prompt versions and responses.
Media leaders across six APAC markets moved from delayed monthly reports to forward forecasts with calibrated ranges. The system expanded from one to three countries within two months. Conformal prediction made the forecast suitable for budget decisions because it showed both the estimate and its uncertainty.